
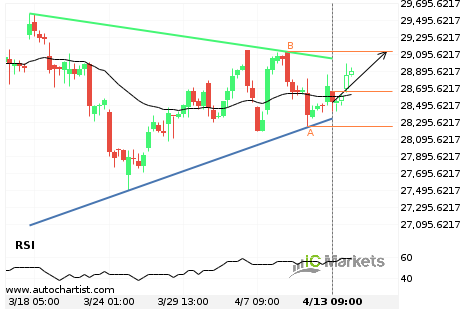
Will Hong Kong 50 Index have enough momentum to break resistance?
Hong Kong 50 Index is heading towards the resistance line of a Triangle and could reach this point within the next 3 days. It has tested this line numerous times in the past, and this time could be no different from the past, ending in a rebound instead of a breakout. If the breakout doesn’t […]
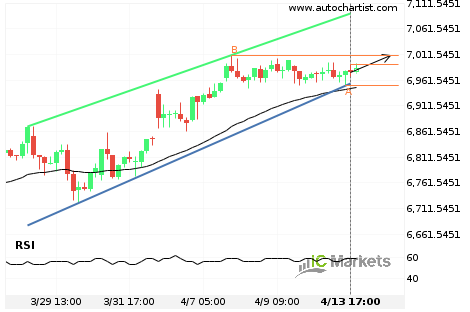
Will Australia 200 Index have enough momentum to break resistance?
Australia 200 Index is heading towards the resistance line of a Channel Up and could reach this point within the next 3 days. It has tested this line numerous times in the past, and this time could be no different from the past, ending in a rebound instead of a breakout. If the breakout doesn’t […]
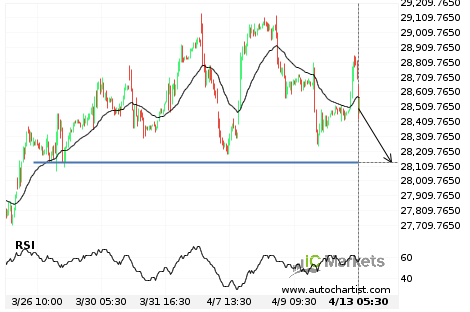
Should we expect a breakout or a rebound on Hong Kong 50 Index?
The movement of Hong Kong 50 Index towards 28133.5996 price line is yet another test of the line it reached numerous times in the past. We expect this line test to happen in the next 2 days, but it is uncertain whether it will result in a breakout through this line, or simply rebound back […]
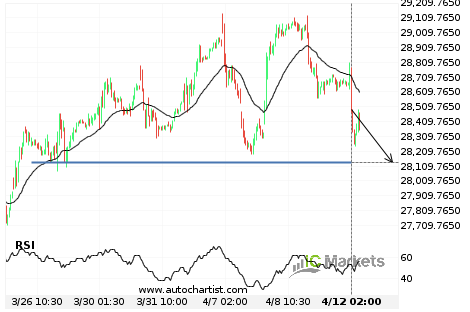
Should we expect a breakout or a rebound on Hong Kong 50 Index?
The movement of Hong Kong 50 Index towards 28133.5996 price line is yet another test of the line it reached numerous times in the past. We expect this line test to happen in the next 23 hours, but it is uncertain whether it will result in a breakout through this line, or simply rebound back […]

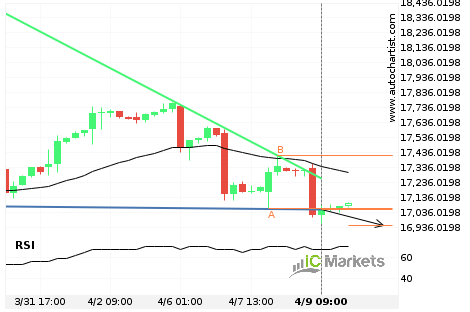
A start of a bearish trend on FTSE China A50 Index
FTSE China A50 Index has broken through a support line of a Descending Triangle chart pattern. If this breakout holds true, we expect the price of FTSE China A50 Index to test 16950.0066 within the next 2 days. But don’t be so quick to trade, it has tested this line in the past, so you […]
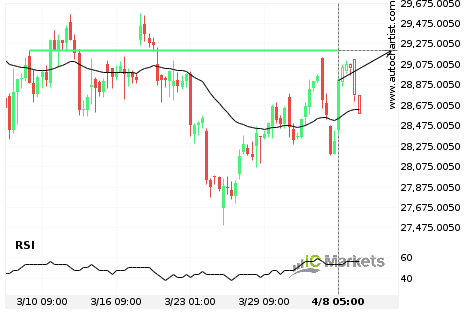
Should we expect a breakout or a rebound on Hong Kong 50 Index?
The movement of Hong Kong 50 Index towards 29210.5996 price line is yet another test of the line it reached numerous times in the past. We expect this line test to happen in the next 2 days, but it is uncertain whether it will result in a breakout through this line, or simply rebound back […]
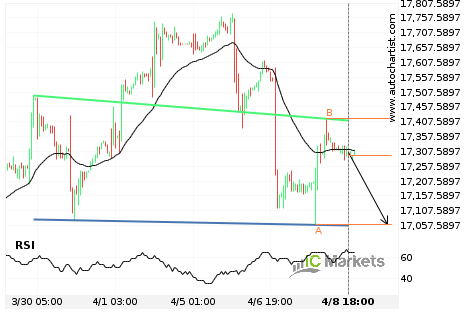
Breach of support line imminent by FTSE China A50 Index
FTSE China A50 Index is moving towards the support line of a Head and Shoulders which it has tested numerous times in the past. We have seen it retrace from this line before, so at this stage it isn’t clear whether it will breach this line or rebound as it did before. If FTSE China […]